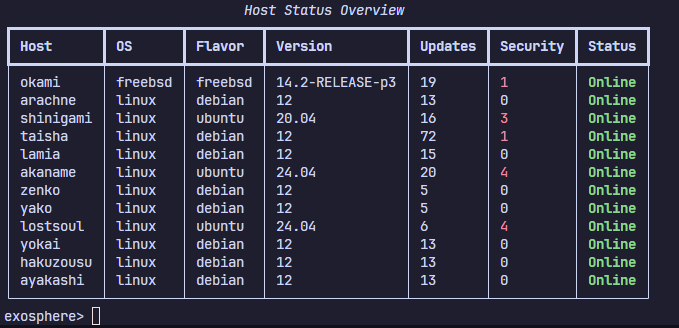
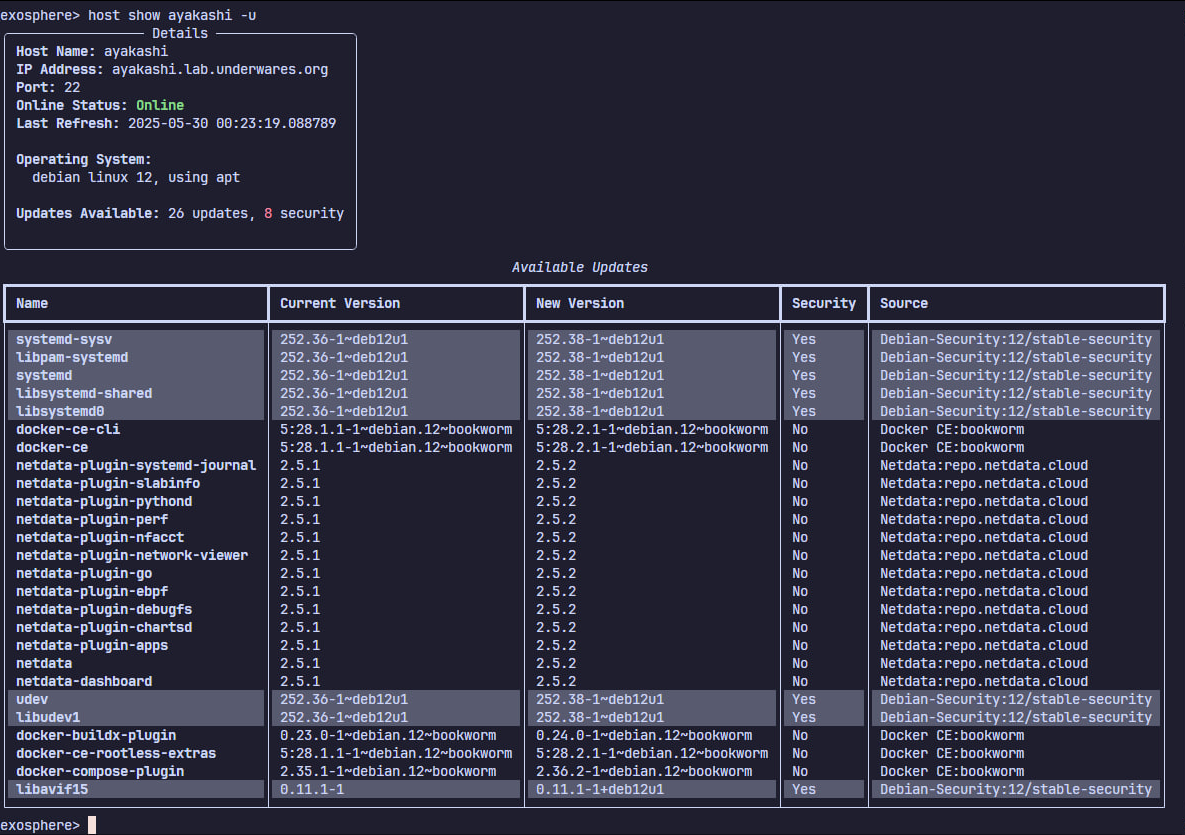
@mr_daemon Heh. I find myself building almost the same screen this morning, but for CI test results.
My homebrew tool for patches reporting is shaping up nicely. Apologies for the horrifying video aspect ratio.
It can now save and cache state across runs, which is nice.
@aliceice You populate the configuration file in any format (toml, yaml, json, straight up Python mapping) with hosts and connection details. (works best with ssh agents and key pairs).
Then on first load you do an inventory sync and it connects to the systems in parallel using fabric through a thread pool, and runs a series of commands and file reads to determine what os and flavor is at play. It then matches one of the package manager providers that all implement a basic api for this information (so adding new ones is fairly straightforward). Then whenever you refresh a system it calls that api, which in turn does more fabric commands to slice and dice the output of the package manager and coerce it into a dataclass with common fields.
Ultimately, all of this gets serialized to disk in a shelve based cache that I extended to do lzma compression. I then have a bunch of Typer commands to query any of it and render it in a nice Rich based output, in a makeshift REPL.
Its actually weirdly reliable.
@mr_daemon what's it called?
@thesargard Tentative name is Exosphere, I'm probably going to release it publicly when it's feature complete and cleaned up
I finally managed to write the Yum/DNF provider abstraction for RHEL like systems for my little patch reporting program.
It was all sorts of irritating because the package manager has all the low level information but only feeds it to you piecemeal via yum/dnf, so this is parsed out in 3 queries.
In the end, it just works transparently.


@mr_daemon is this fleet control app just for patches?
@Viss So far yes. It doesn't even apply them for you either, since there's way better automation tooling available for that, like say, Ansible
But so far it's a nice way of getting a centralized view of
1) is all my shit up to date
2) is everything up
Which are two questions I have often lol
@Viss That said I've written it to be extensible enough that if I suddenly have a third recurring question, it can definitely be made to tell me the answer.
@mr_daemon sounds pretty great!
My little patch reporting program is nearing the state where it's probably solid enough to release in the wild, I think.
I just have to write some documentation, clean up some authentication details, and figure out what is the lowest version of Python I'm willing to support outside of uv.
Here is a short demo of how it works in practice


